My home infrastructure observability stack has been relatively static (for some definition of static) for awhile. VictoriaMetrics + Loki has been ‘fine’. But I like dabbling with other alternatives, and this time it is Greptime.
Greptime - what is it?
https://greptime.com is basically unified storage of all observability data. I’m not trying to market it too hard here, but basically:
- It is Rust
- It handles storage in various ways
- local ( using Parquet format )
- object storage ( no idea, not tried yet )
- …
- It allows clients to use various APIs (this list is not exhaustive, just ones I find interesting)
- Prometheus
- Vector has built-in sinks for it
- pg, mysql
- it also has built-in GUI
Integration with my infra
Vector before Greptime
I run Vector at home. Hard. Here’s the vector graph before Greptime: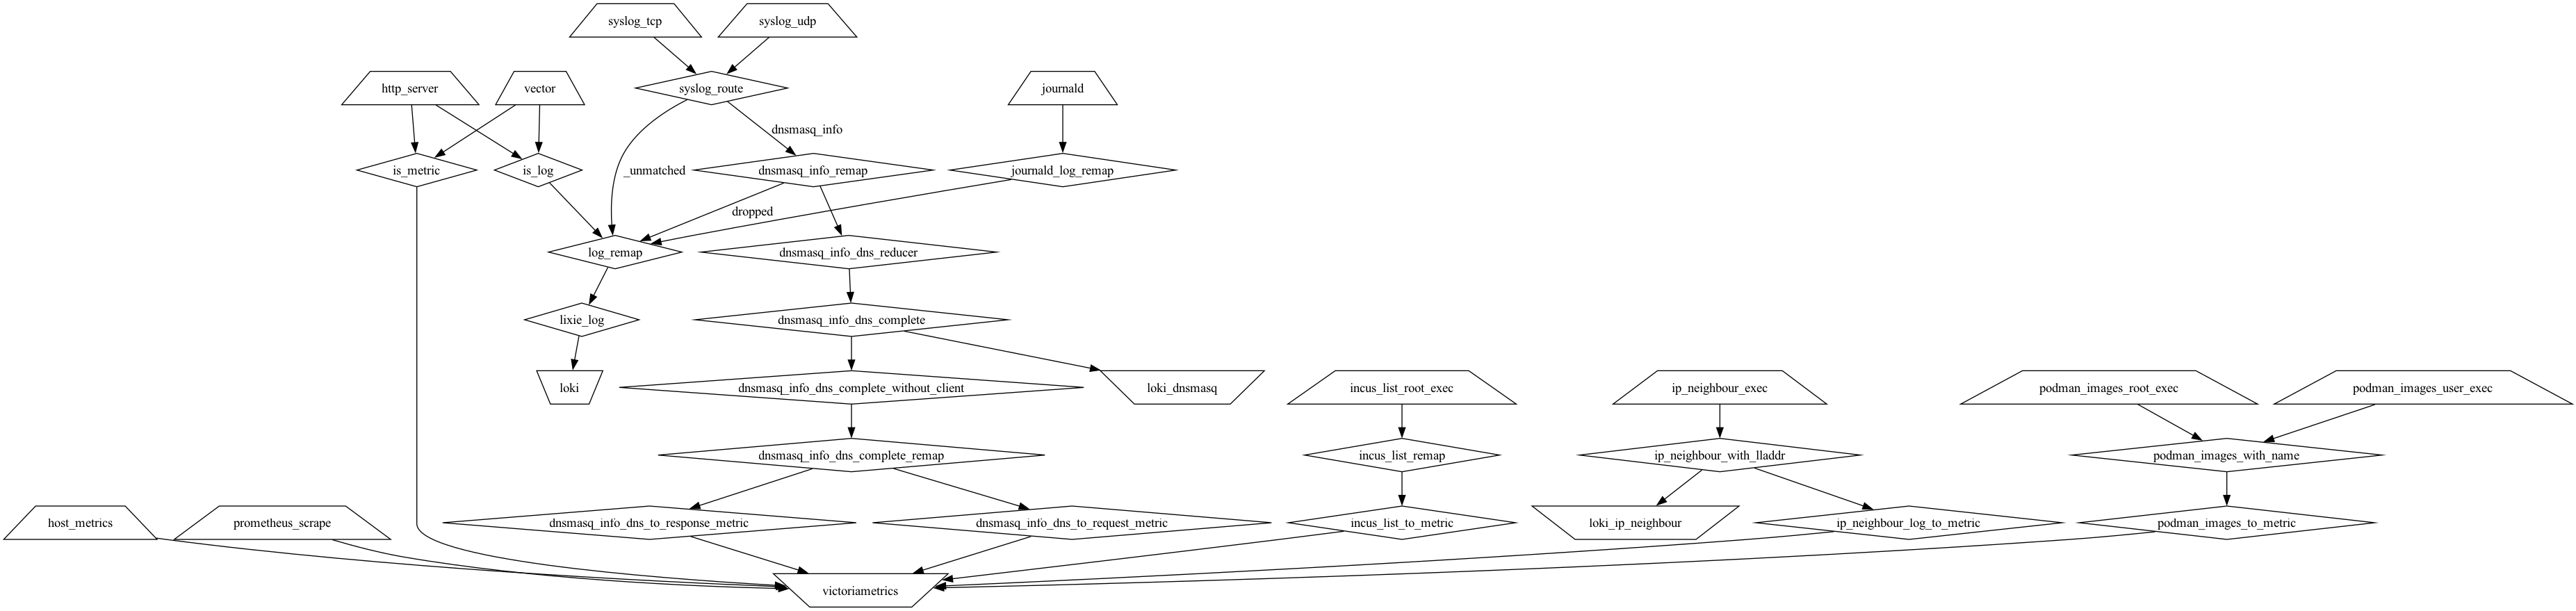
I gather ‘some stuff’ and write it to either Loki or VictoriaMetrics.
Vector after Greptime
I decided to do some clean-up of the graph, and added intermediate targets (note that there’s more than one loki sink above as I wanted to set different source labels on the things I was sourcing from exec type sources). I added intermediate source_x transforms which add labels to things I want to log to Loki, and then gather them to sources_log, which contains all of my log data.
Subsequently in sources_log_x I mutate them so they fit the sinks I use, either Loki or Greptime. Here’s what the graph looks like after the changes:
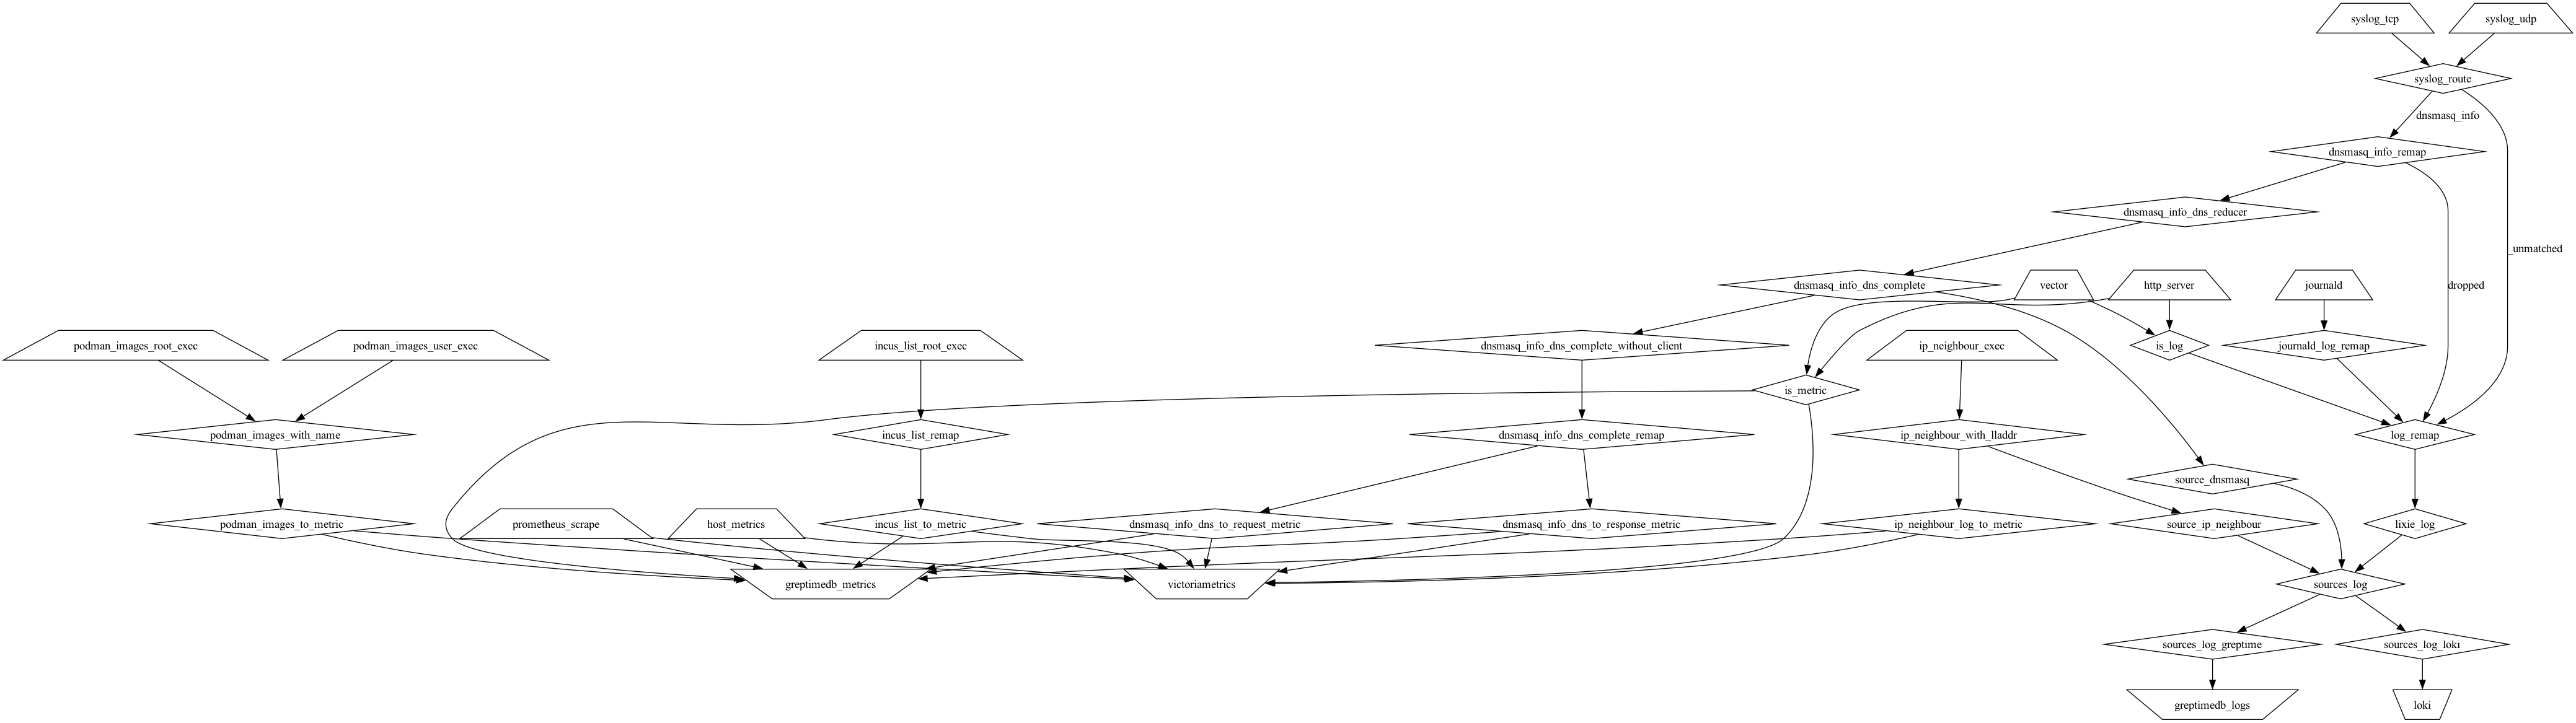
I’m not going to document everything in the graph in my blog, but these two log sink specific ones seem worth writing about. So, here they are:
  sources_log_loki:
    type: remap
    inputs: [sources_log]
    source: |
      # Loki MUST have value for all labels, even if they are empty
      # source should be always set
      .host   = string(.host)   ?? ""
      # non-Lixie logs are not interesting
      .lixie  = string(.lixie)  ?? "spam"

  sources_log_greptime:
    type: remap
    inputs: [sources_log]
    source: |
      # Define the fields you want to keep at top level
      keep_fields = ["timestamp", "level", "message", "host", "level", "lixie", "source"]

      # Capture the full event before modification
      remaining = {}

      # Collect fields NOT in keep_fields into remaining
      for_each(keys(.)) -> |_index, key| {
        if !includes(keep_fields, key) {
          remaining = set!(remaining, [key], get!(., [key]))
        }
      }

      # Delete non-kept fields using filter at root level
      . = filter(.) -> |key, value| {
        includes(keep_fields, key)
      }

      # JSON-encode the remaining fields into .data
      .data = encode_json(remaining)

      # Test: Also insert it as is
      #.remaining = remaining
      # (These are auto-expanded and still cause problems -> let's not do this)
This exposes the fundamental difference in data storage between Loki and Greptime: Loki stores data by labels, and therefore they must be always specified. Greptime on the other hand (by default) stores them in just single ’logs’ table, BUT by default the greptime_identity pipeline expands all JSON fields to be separate columns, and unfortunately as I gather data from probably hundred different sources, the types of the JSON fields are not same (e.g. there are both float64 and string duration keys in the JSON dicts).
This forces me to rewrite the Greptime logs so that ‘known good’ ones are retained as columns, and the rest I stick to ‘data’ which is encoded as JSON string (if I insert it as is, as noted in the commented .remaining block, Greptime will just automatically create sub-columns like remaining.duration which again cause problems).
Minor Greptime bug I encountered
When using Vector, I was surprised to see that the greptimedb_metrics backend of Vector did not produce proper metrics in Greptime ( https://github.com/GreptimeTeam/greptimedb/issues/7934#issuecomment-4387872117 ). However, as prometheus write was fine, I just moved on. Relevant snippet from my configuration:
  greptimedb_metrics:
    type: prometheus_remote_write
    endpoint: ...
    #type: greptimedb_metrics
    #endpoint: ...
    # GRPC - 1.0.1 does not seem to produce logical table
It might be just versions of tools at the time, but we shall see.
Weird configuration default for logging
I use basic container version of Greptime. By default, it writes logs to /logs/ and relatively verbosely too. Adding this to my podman run fixed the problem:
    -e GREPTIMEDB_LOGGING_DIR="" \
    -e GREPTIMEDB_LOGGING_LEVEL="WARN" \
With it, I get only warnings (info seems verbose), and it logs only to stdout (which leads to ^ Vector pipeline eventually).
I guess I could have used Lixie to cull down non-interesting logs by default (I do this already for most of the things I use and store >= INFO for almost all of them), but I was curious to see how much output it produces on WARN and the answer is very little.
Conclusion
So far Greptime looks promising - I had it running for a couple of days and the on-disk storage was pretty reasonable, as was CPU usage. Now that the Vector graph is fully tuned, it is time to wait for a bit and then play with the data. Perhaps it will actually replace VictoriaMetrics, Loki, or perhaps even both of them in my home observability stack.